Diagnostic Tools
TAC Reports
TAC Reports provide an under-the-hood view on a given verification condition as well as the result that the Prover produced for that verification condition, if available. There are four variants of TAC reports, one each for the results SAT, UNSAT, TIMEOUT, and one that contains no information from the result. In the following, we will discuss these variants one by one. We will begin with the TAC report without Prover result information, since its constituents are present in the other variants as well.
Note
In addition to the information below, there is a brief explanation of how to use TAC reports in the webinar on timeouts.
Plain TAC reports
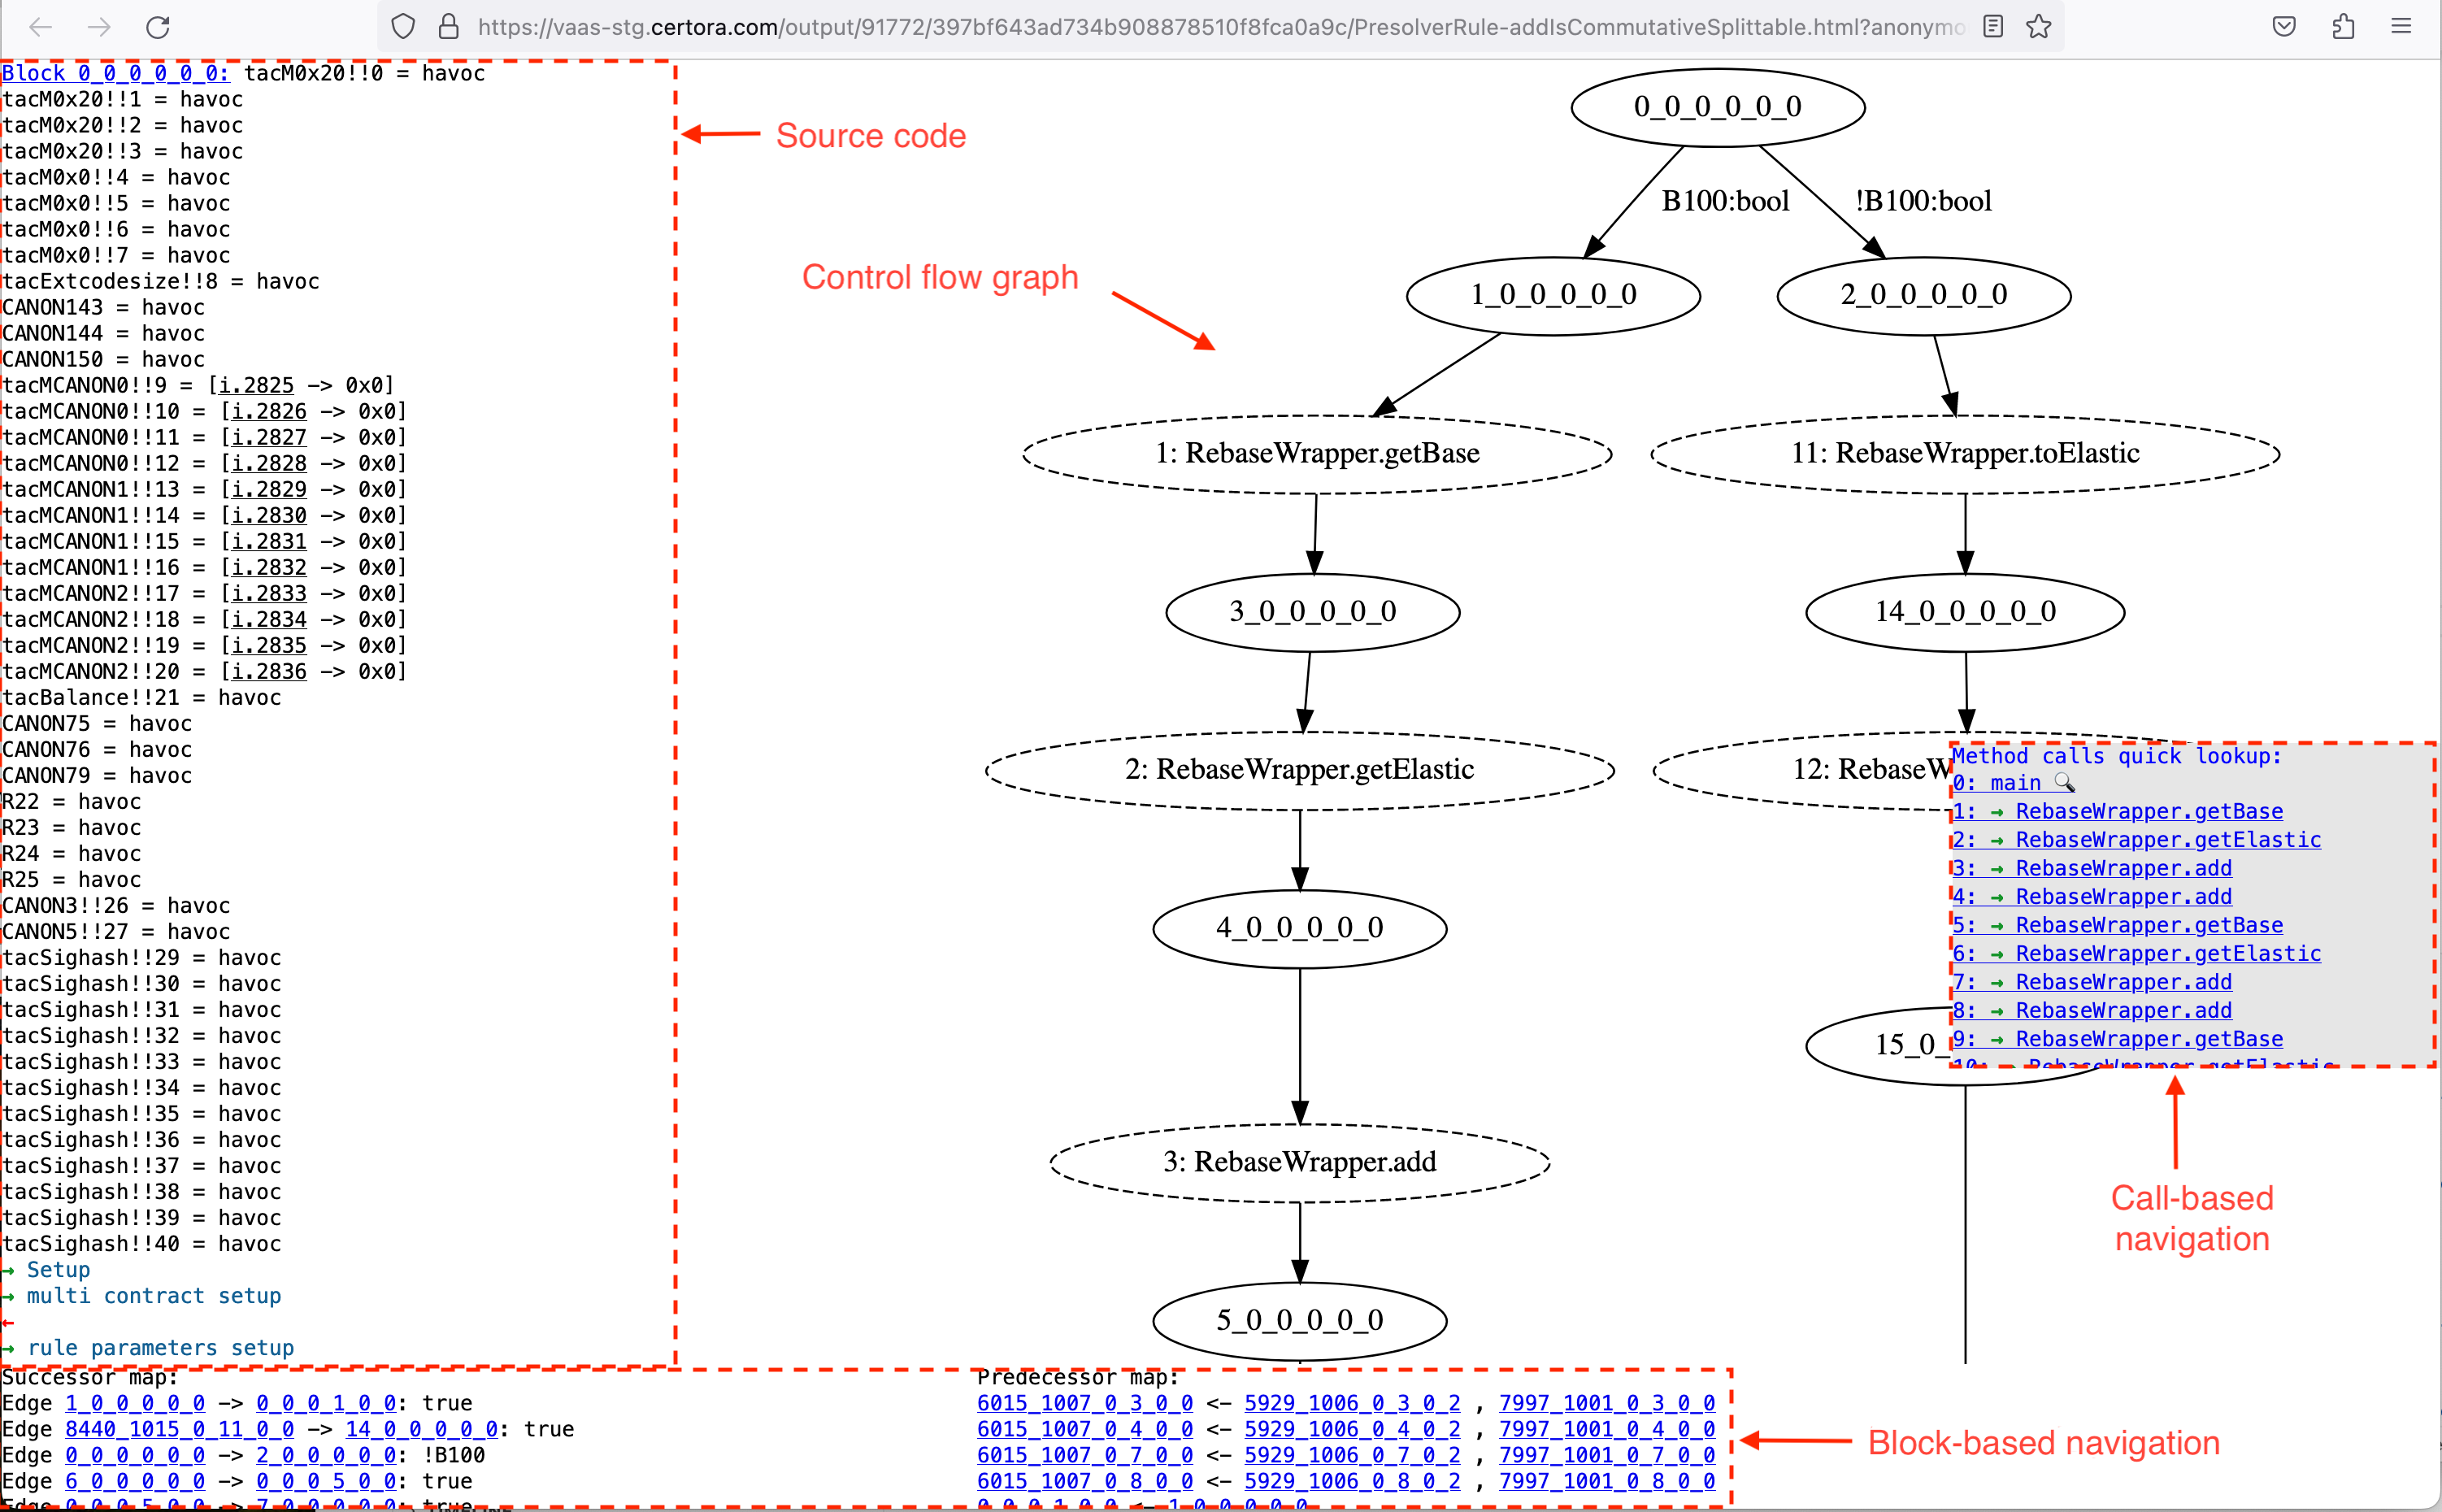
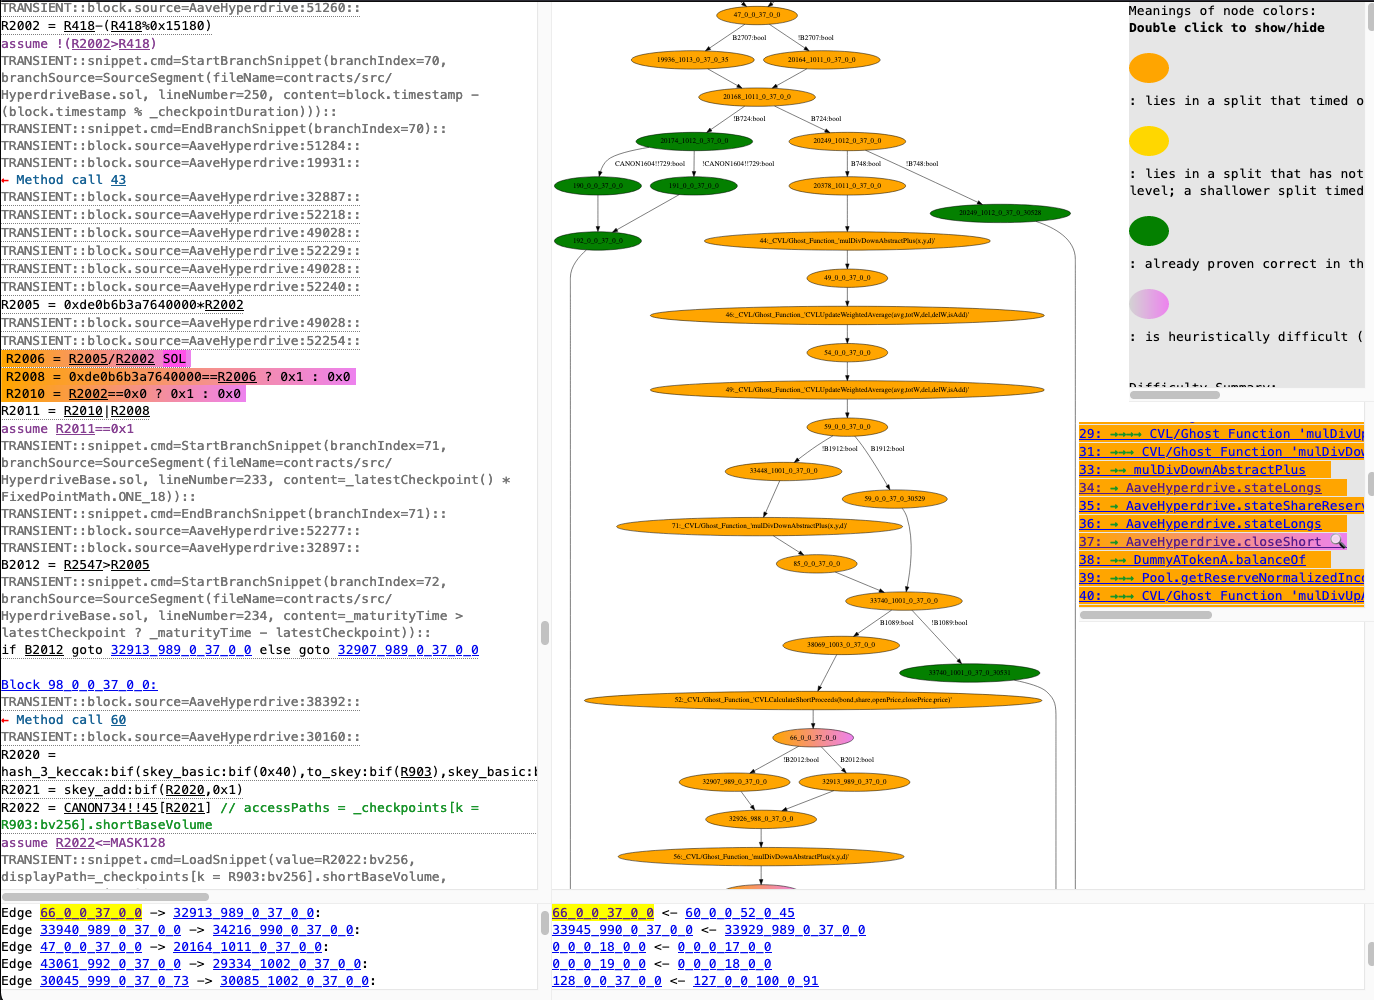
Example of a plain TAC report (with annotations in red)
At the center of a TAC report is a visualization of the verification condition’s control flow graph (CFG).[1] There are two kinds of nodes. Regular nodes and call nodes. Regular nodes have a solid outline, while call nodes have a dashed outline. Clicking on a regular nodes will make the source code box (discussed below) focus on the corresponding TAC source code; clicking on a call node will replace the currently displayed CFG with the CFG that belongs to the called method.
Note
Only external calls are explicit in the TAC report’s CFGs. Internal calls are inlined on the TAC source code level.
The upper-mid left part of a TAC report contains the TAC source code. The details of the TAC language are outside the scope of this documentation. Generally speaking, TAC is generated by compiler-style transformations of the EVM bytecode together with the CVL specification. Many patterns from EVM bytecode are retained in TAC, however inlining of functions and various simplifications have already happened at the stage that the TAC reports display. Also, CVL method summaries from the spec have been applied on this stage, and any unintentional lack of summarization can be diagnosed here.
Some commands in the TAC source code have pointers to the program or CVL code that the TAC program was created from. These commands are highlighted a dotted underline; the source code location they have been translated from is revealed on hovering with the mouse over such a command, as displayed in the image below.
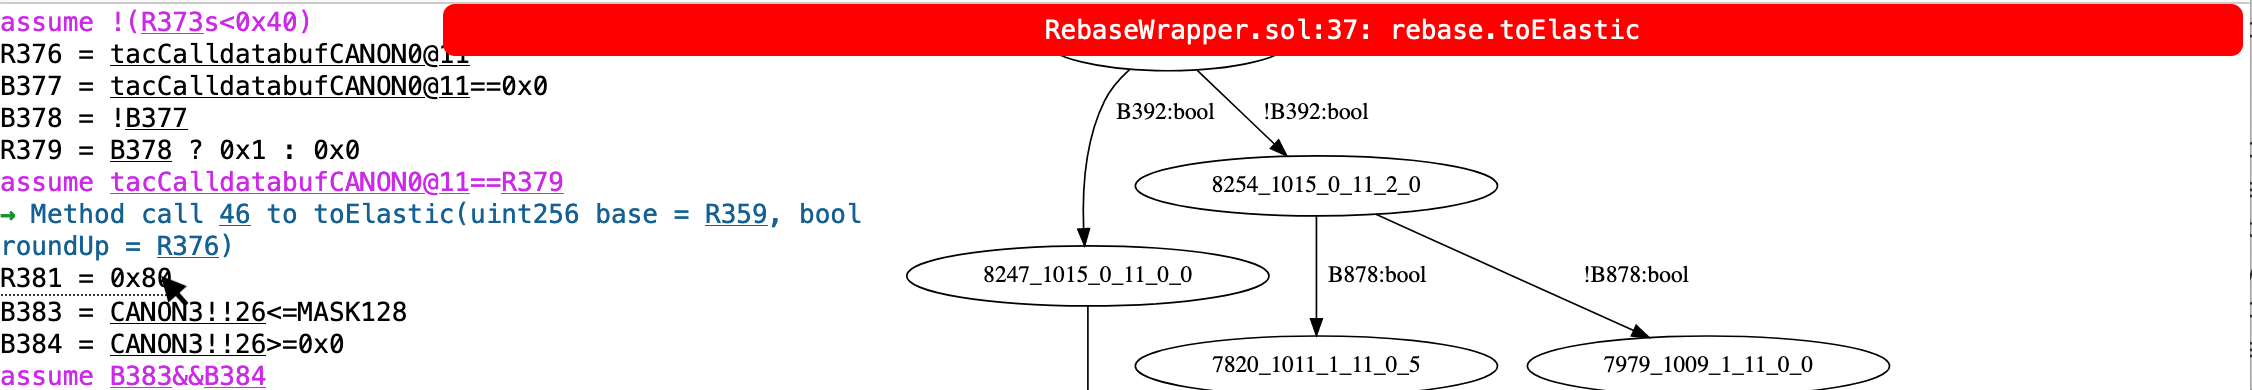
source pointer is shown on hover over TAC commands that have a dotted underline
The call-based navigation on the mid-right side of the report lists all the calls in the TAC program. Each call is identified by a number. After the number there is a number of arrows, indicating the nesting depth of the call, i.e. calls from spec get one arrow, a call from a method body with one arrow gets two arrows, etc.; see the picture below for an example. After the arrows the name of the called method is given. Each of these calls is clickable and will lead to the corresponding CFG.
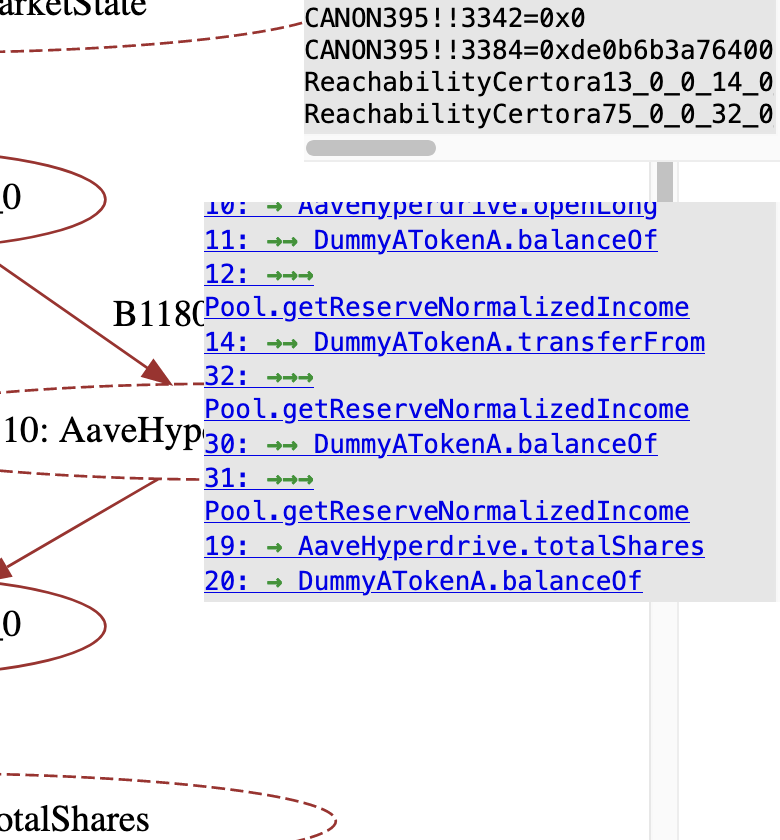
arrows indicating the “depth” of a call in the call links
The bottom part of the TAC report shows a more-detailed control-flow relations within individual nodes. These are usually not useful for the tool user, so we will ignore them in the remainder of this document.
SAT TAC reports
Once a rule has been checked with a SAT outcome, a TAC report like the one
in the figure below is generated. In addition to the components of the plain TAC
report, this report variant illustrates the model (aka. counterexample)
that is provided by the SMT solver to witness violation of an assert command
(or the fulfillment of a satisfy command). The model is illustrated by a path
in the control flow graph and a valuation of the TAC program variables.
example TAC report for a run with a SAT result
The path corresponds to the call trace from the report. It is the path through the program that is taken on the input given by the counterexample. The arrows and nodes in the control flow graph that lie on this path are displayed in red.
The valuation is given in the box in the top right. It lists every variable in the TAC program along with the value that it has in the current counterexample.
Note
The names of the TAC variables are often not helpful for understanding what they
mean, but the context (e.g. operations they occur in, or the source pointers) can
give some hints.
Running the Prover with the option
--prover_args "-canonicalizeTAC false" can lead to more helpful variable names
in some cases, especially the names of CVL variables are mostly preserved.
UNSAT TAC reports
By default, the TAC report in the UNSAT case is the same as the plain TAC report.
When the --coverage_info option is set either to basic or advanced
(default is none), a version of the TAC reports is shown that illustrates
coverage information about the rule. In particular, nodes in the control flow
graph that were used for proving the rule are displayed with a green fill color,
while nodes that were definitely irrelevant to the proof are displayed with a
yellow fill color.
Timeout TAC reports
In case of a Timeout result, the TAC report contains additional information that is meant to help with preventing the timeout in the future.
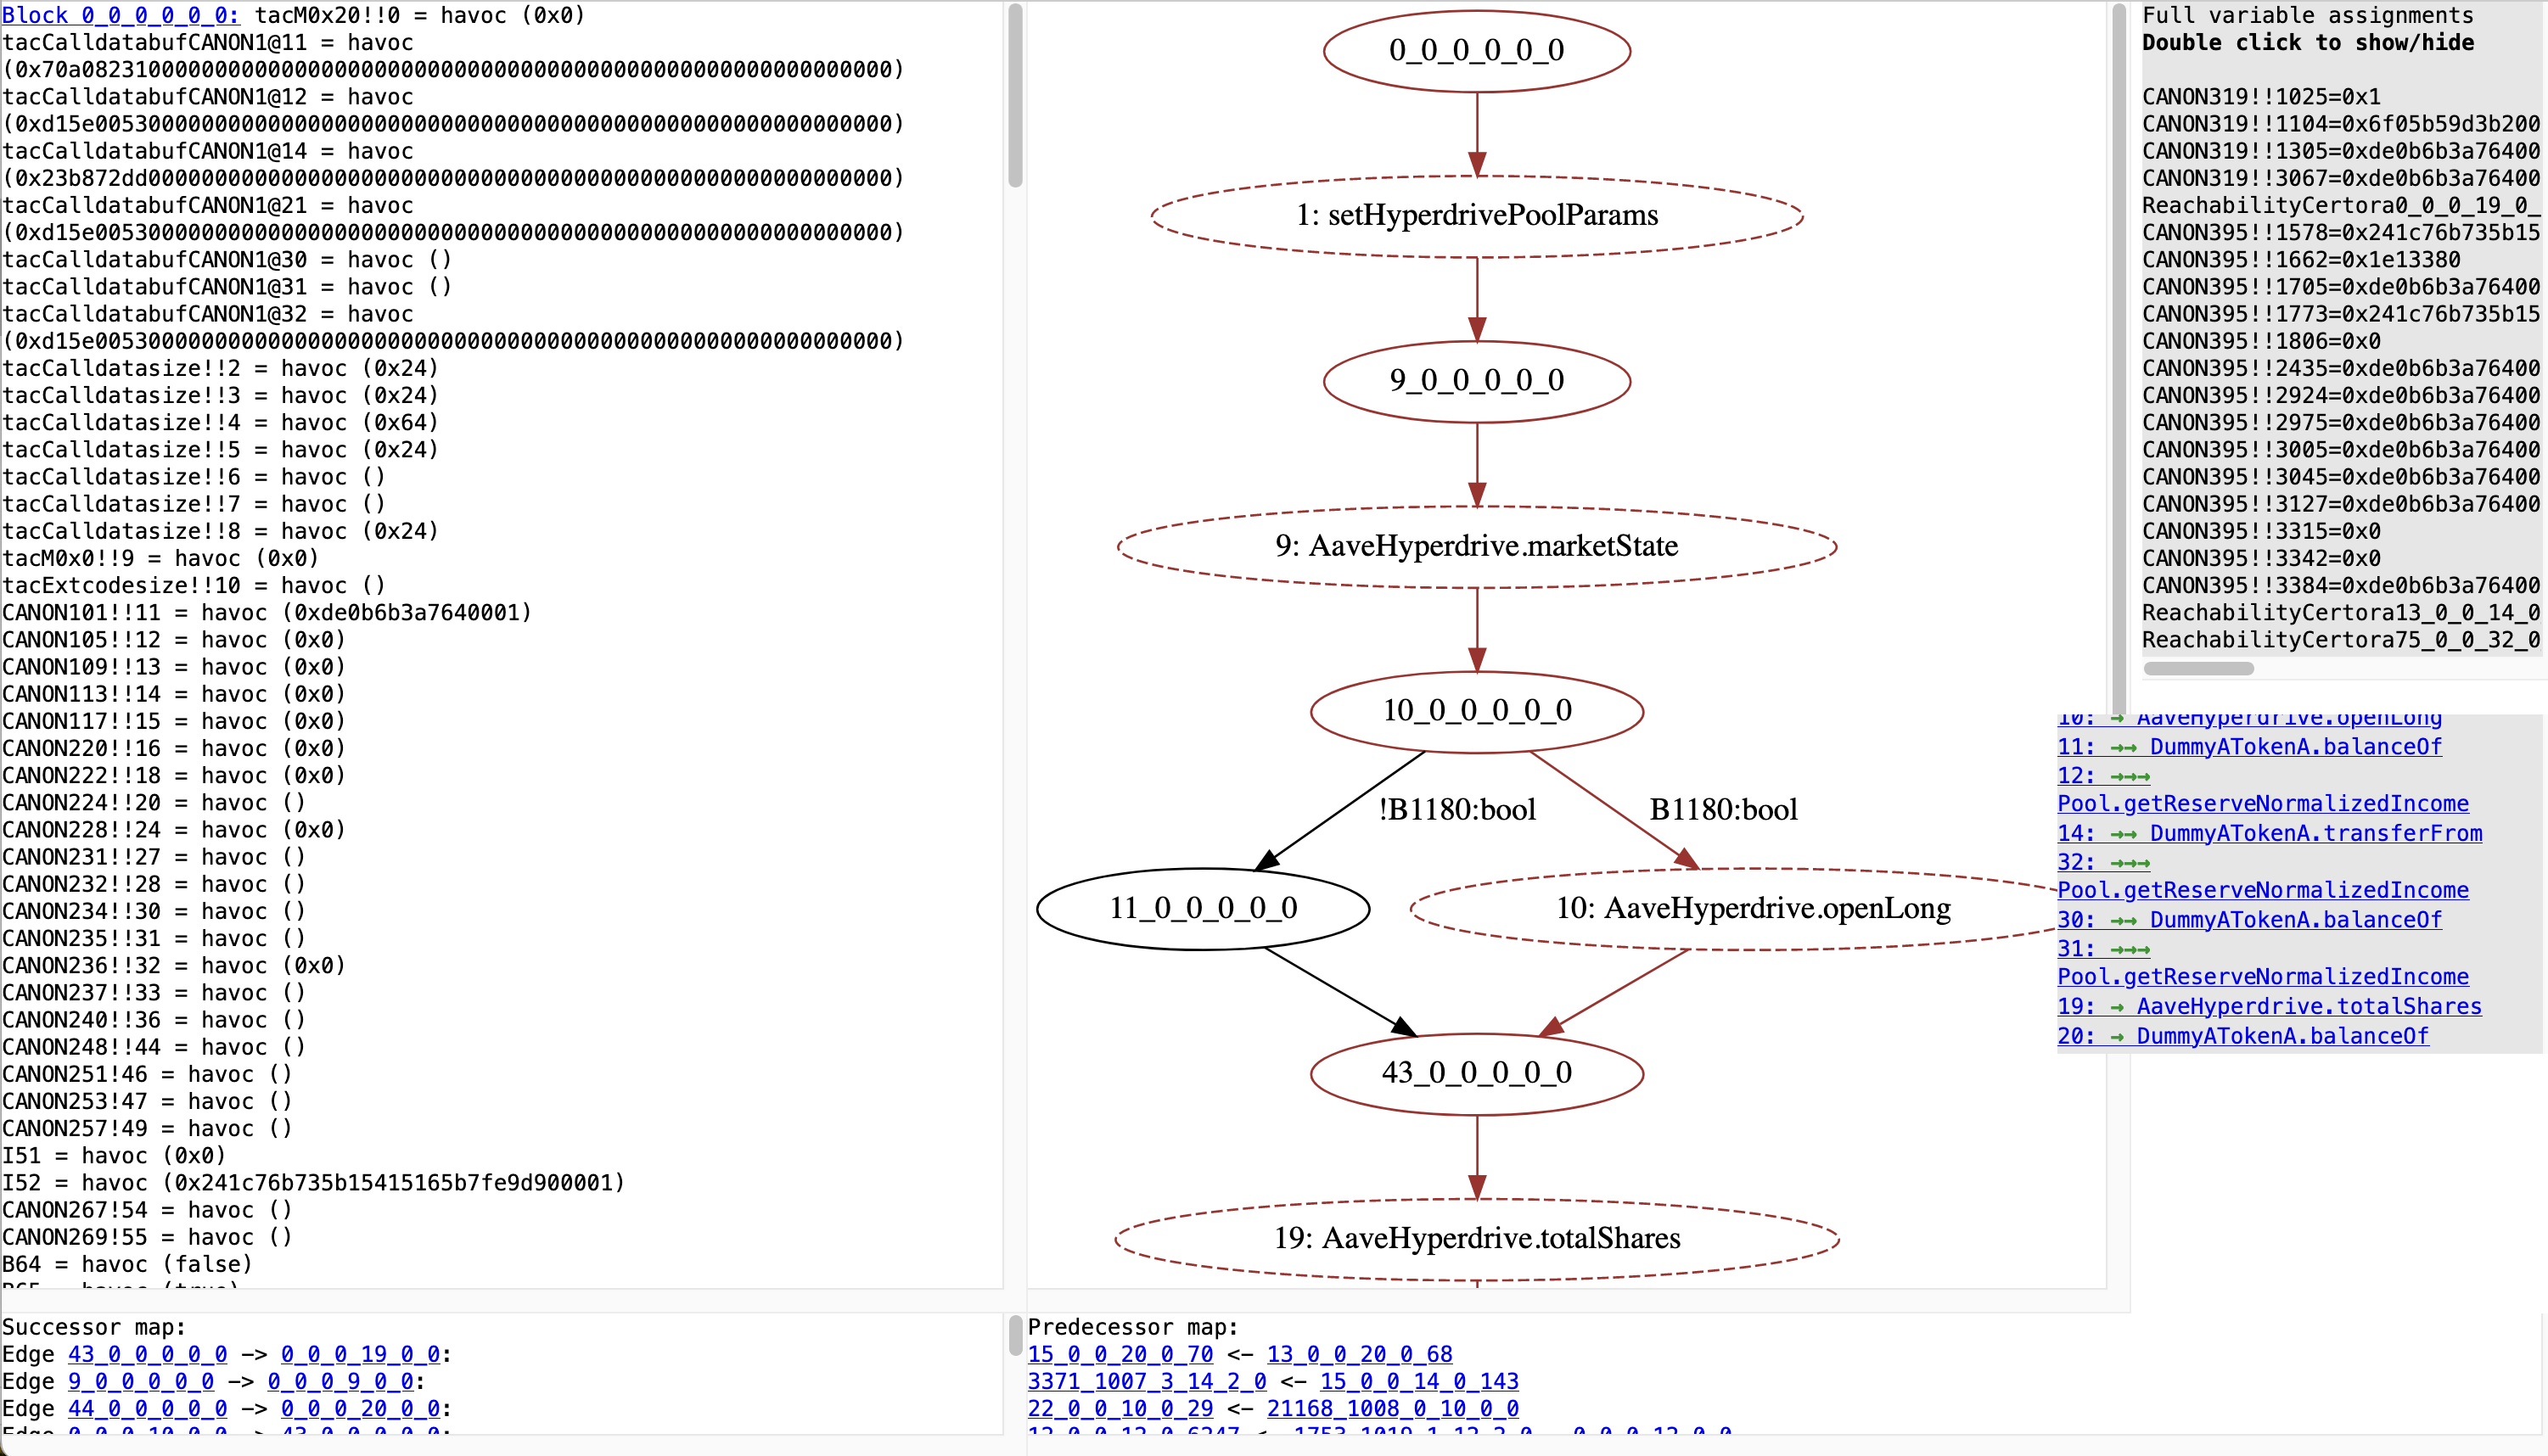
example TAC report for a run with a Timeout result
The figure above shows a TAC report that was generated from a Certora Prover run that timed out. Compared to the plain TAC report, additional information is available in three ways:
Explanations and statistics are given in the box in the top right corner (double click to expand).
CFG nodes have colors that indicate how the Prover run went and which parts are difficult.
In the source code box there is difficulty information given by color highlights to some commands and by additional text giving difficulty statistics on difficult code blocks .
Statistics- and explanation-box
The box in the top right of the Timeout TAC reports contains explanations on the node colors as well as statistical information pertaining to how difficult the verification is to solve in general and what might be the particularly difficult parts.
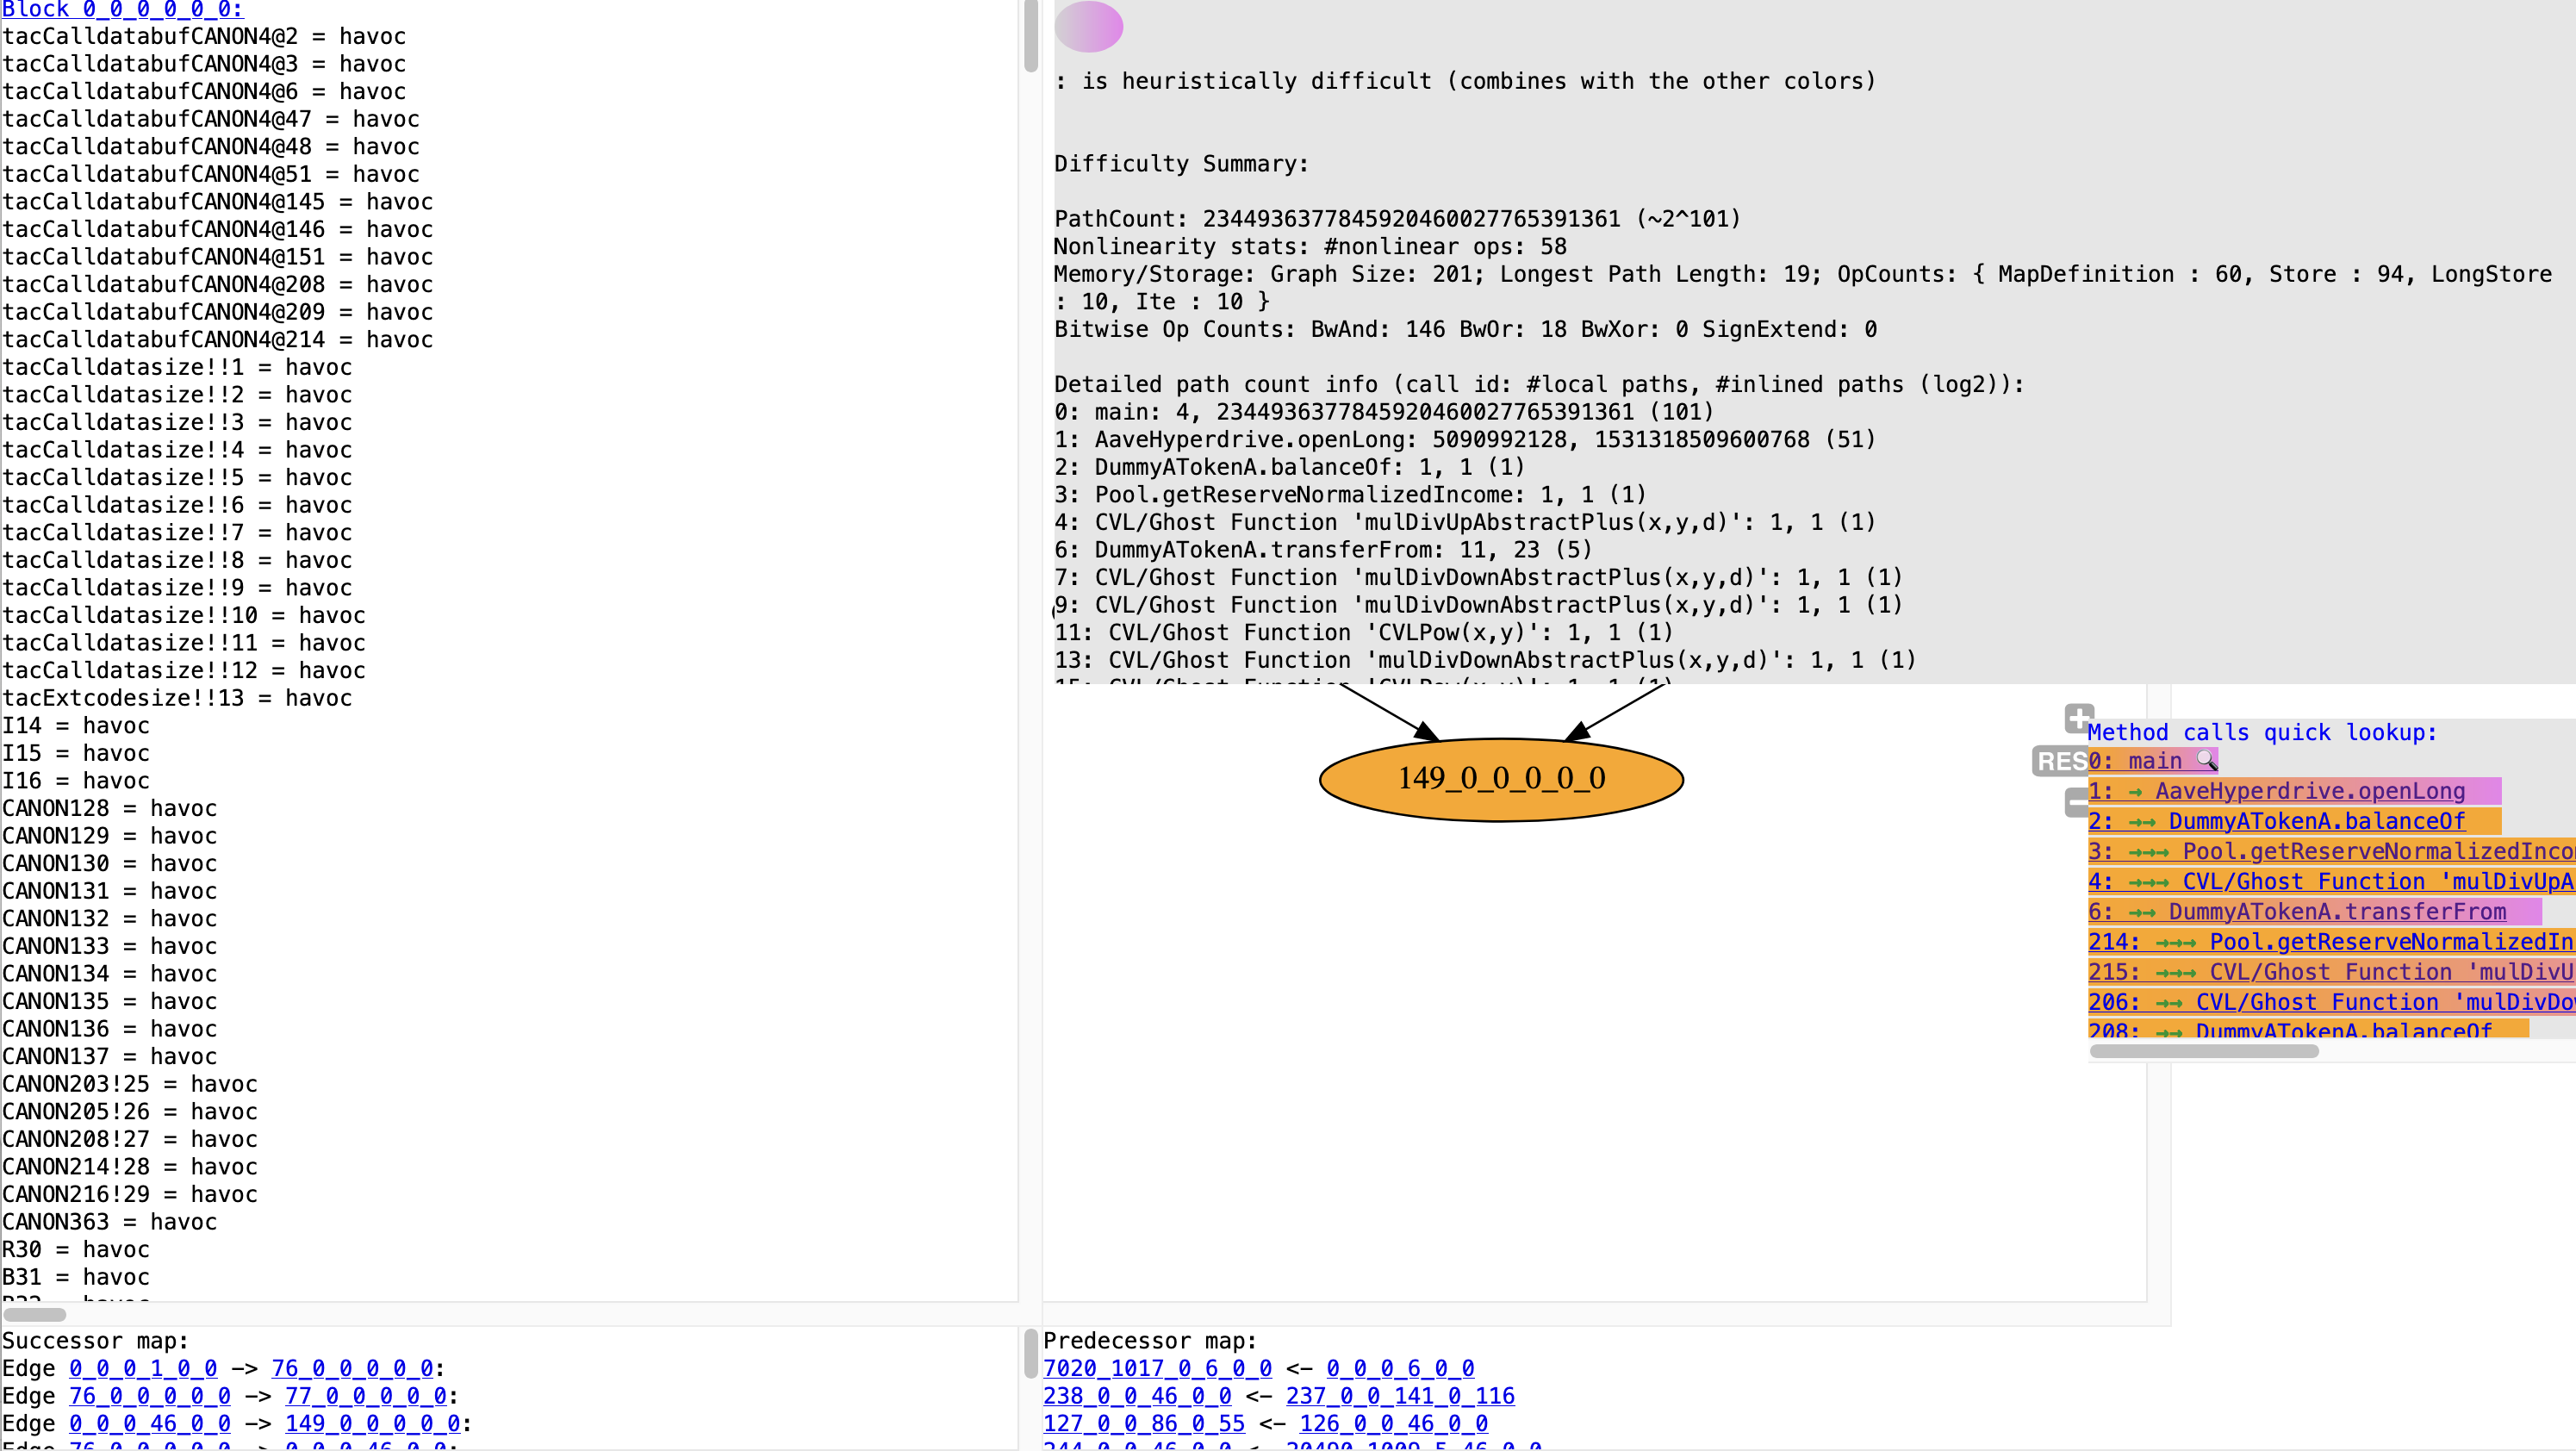
Timeout TAC report with expanded statistics- and explanation-box
The above picture shows the expanded statistics- and explanation box. Currently, the contents of the box are the following:
explanations for each color used in the CFG nodes
general difficulty-related statistics pertaining to the whole program
per-call breakdown of the “path count” statistic
per-call breakdown of the “number of nonlinear operations” statistic
Split- and heuristic difficulty-coloring in CFG and source code
The fill-colors of the graph nodes in the timeout TAC report summarize the outcomes of the individual control flow splits for the current rule. See Control flow splitting for background on the procedure. An additional violet gradient is used to indicate nodes that are likely to contain code that is difficult for the Prover to handle.
Nodes that have a green fill color are contained exclusively in splits that have been successfully proven UNSAT by the current run of the Prover. This means they are at least manageable for the Prover, although they still might have taken significant time to prove.
Nodes that have a orange fill color lie on a split whose checking has timed out under the timeout specified by --smt_timeout <seconds>. This means that the combination of the orange nodes was too difficulty to solve within that time. Note that this does not say anything about the difficulty of any individual orange node.
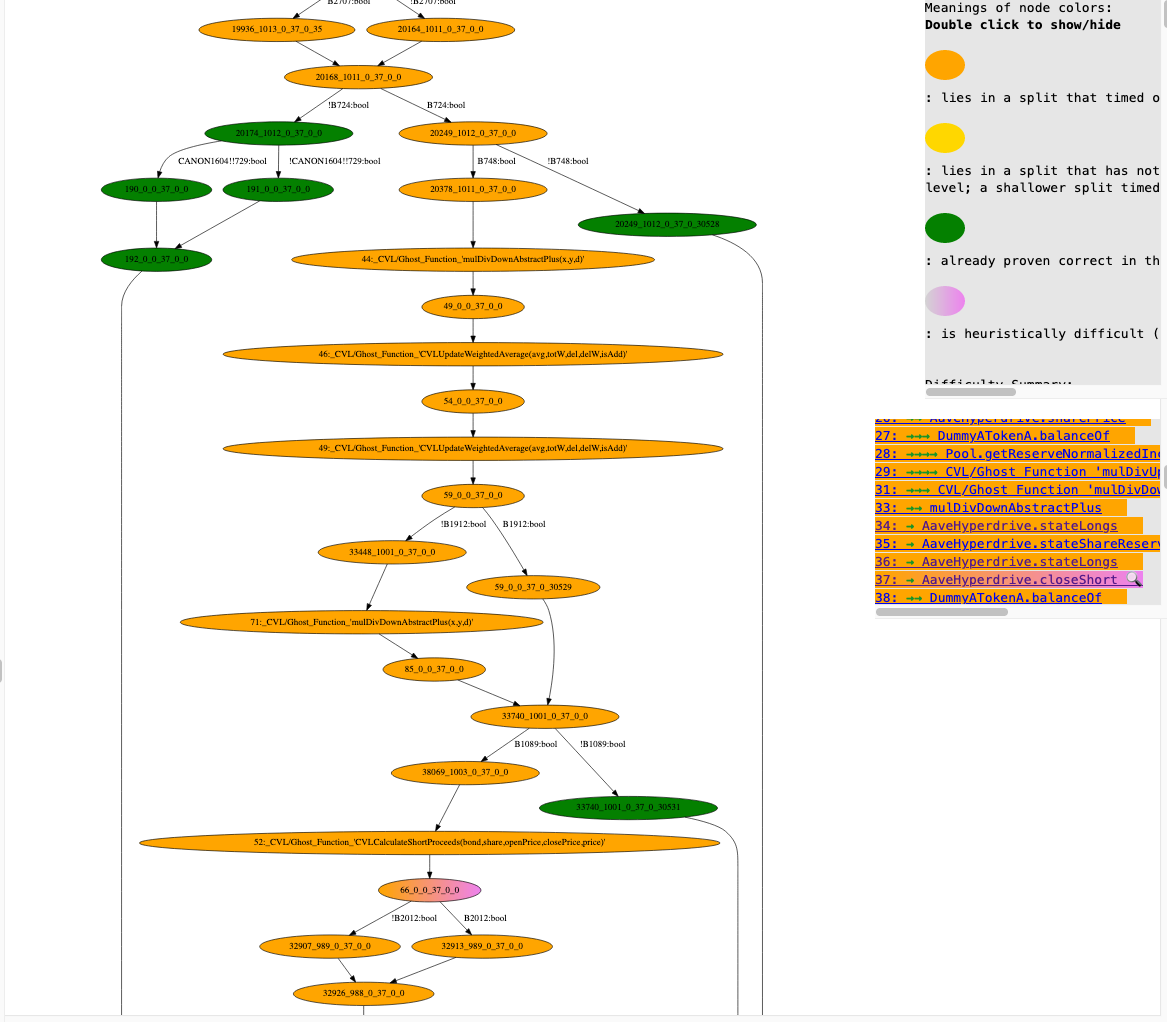
CFG segment with orange and green nodes
Nodes that have a yellow fill color are on splits that were still queued for solving when the timeout on the orange nodes happened. No strong statements can be made about their difficulty at this point.
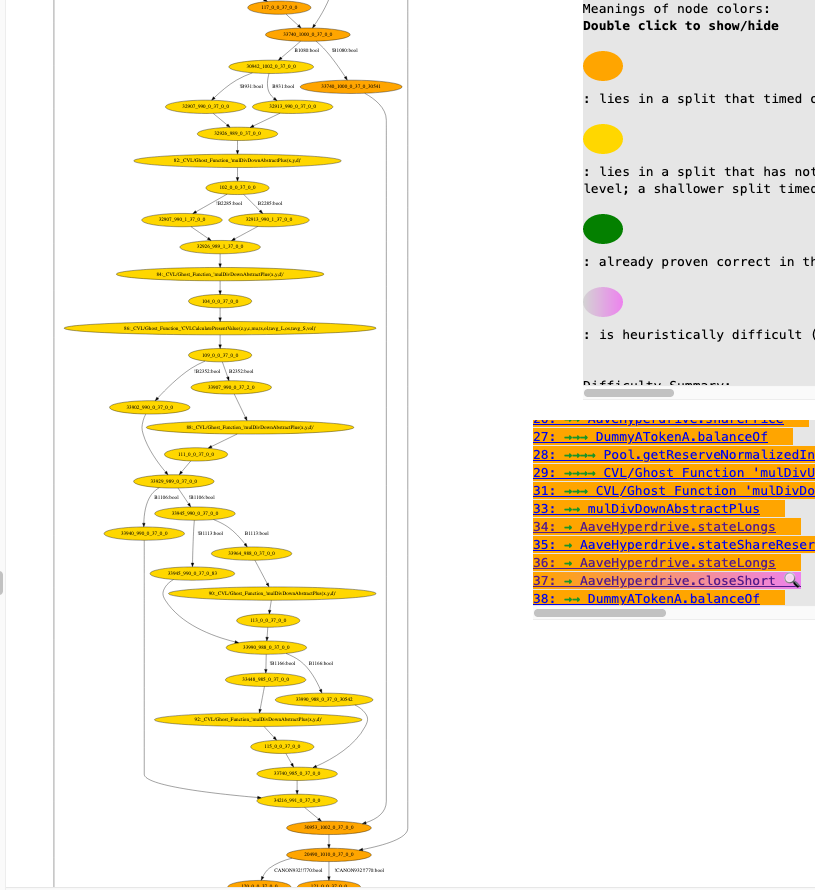
CFG segment with nodes that have not yet been queued during control flow splitting, indicated by the yellow fill color
When a call node has a violet gradient, this means its subgraph contains at least one node with a violet gradient. When a regular node has a violet gradient this means that our heuristic analysis of the node’s difficulty has marked it as potentially difficult.
In practice, the violet highlighting typically means that there are at least two nonlinear operations in the node, or a high number of case splits. Nonlinear operations include multiplications of two non-constant values, divisions by a non-constant value, and more. Case splits can be induced by hashing unbounded arrays among other things.
When a regular node is marked violet, the source code in the source code box of the report will contain highlights of the relevant lines, as well as a summary of the difficult operations a the top of the block corresponding to the node.
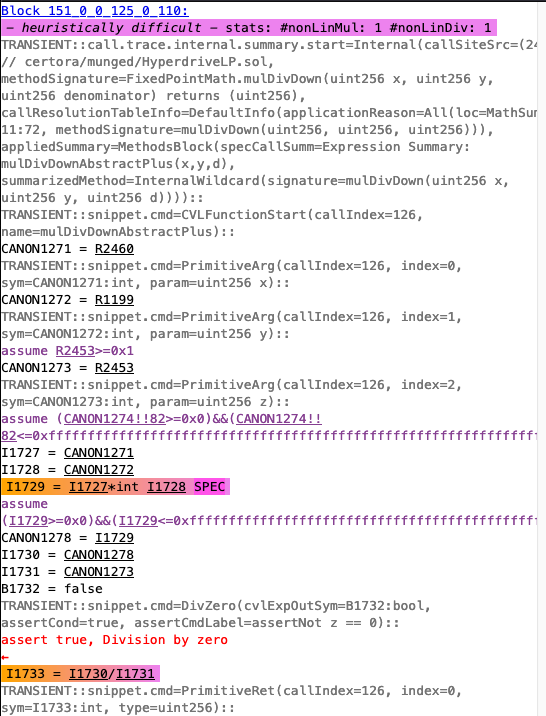
Source code with highlighting and difficulty summary